Affiliate marketing thrives on precision. One wrong move with your budget allocation, and you’re watching money disappear faster than you can track conversions. The difference between profitable campaigns and costly mistakes often comes down to understanding three fundamental metrics that separate successful affiliates from those constantly struggling to break even.
Table of Contents
- Understanding the foundation of affiliate profitability
- Cost Per Action decoded
- Earnings Per Click fundamentals
- Conversion Rate optimization strategies
- Essential calculation formulas
- Practical implementation methods
- Budget protection techniques
- Performance monitoring systems
Understanding the foundation of affiliate profitability
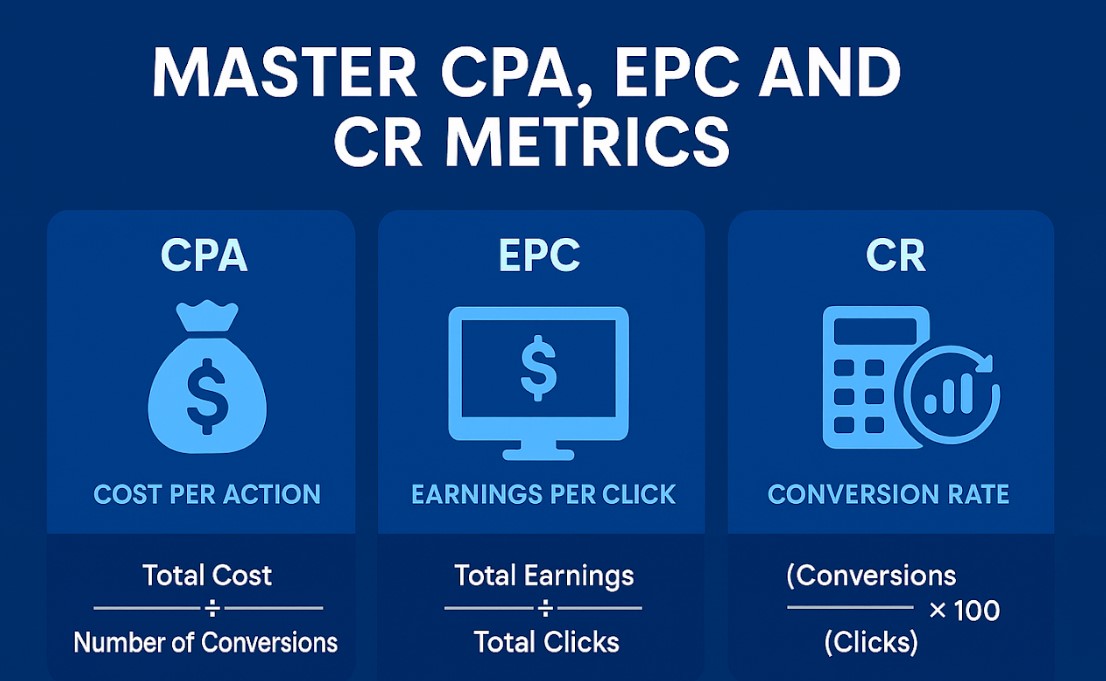
Cost Per Action represents the actual expense required to generate a single desired outcome from your traffic. Unlike basic click costs, this measurement reveals the true economic reality of your promotional efforts. When calculated properly, it becomes your north star for campaign viability.
The beauty of CPA lies in its directness. You spend $500 on traffic and generate 25 conversions – your cost per action sits at $20. This clarity cuts through vanity metrics and focuses attention on what actually moves the needle for revenue generation.
However, many affiliates miscalculate this figure by excluding indirect costs. Platform fees, creative development expenses, and testing budgets all contribute to your true acquisition cost. A comprehensive approach includes these elements for accurate profitability assessment.
| Metric | Definition | Calculation | Benchmark Range |
| CPA | Cost to acquire one conversion | Total Spend ÷ Total Conversions | $5-$150 (varies by vertical) |
| EPC | Revenue generated per click | Total Revenue ÷ Total Clicks | $0.10-$5.00 |
| CR | Percentage of visitors who convert | (Conversions ÷ Clicks) × 100 | 1%-15% |
| ROI | Return on investment percentage | ((Revenue – Cost) ÷ Cost) × 100 | 150%-500%+ |
Earnings Per Click fundamentals
EPC transforms raw traffic data into actionable intelligence about your promotional effectiveness. This measurement divides total commission earnings by the number of clicks delivered, creating a per-visitor value that guides optimization decisions. Unlike basic click-through rates or impression counts, EPC reveals the actual monetary value each visitor brings to your campaigns.
Consider two seemingly identical campaigns. Campaign A generates $1,000 from 2,000 clicks, while Campaign B produces $800 from 1,200 clicks. The EPC reveals Campaign A at $0.50 per click versus Campaign B at $0.67 – suddenly the “weaker” performer shows superior efficiency. This insight changes everything about budget allocation and scaling decisions.
Geographic targeting dramatically impacts these numbers. Traffic from tier-one countries typically converts between $0.80-$2.50 per click for quality offers, while emerging markets might range from $0.15-$0.60. Understanding these variations prevents unrealistic expectations and budget misallocation. European audiences often fall somewhere in the middle, with EPC values around $0.45-$1.20 depending on the specific country and vertical.
Device type affects EPC performance predictably. Desktop users generate higher per-click revenue due to focused browsing and stronger purchase intent. Mobile traffic converts differently but offers volume advantages, especially where smartphones dominate usage. Tablets show lower earnings per click but remain profitable with proper targeting.
Timing creates optimization opportunities too. Weekend traffic often performs differently than weekdays, particularly for B2B offers that convert better during business hours. Holiday periods either boost or hurt earnings per click depending on your vertical and audience behavior.
Conversion Rate optimization strategies
Conversion rates fluctuate based on traffic quality, offer alignment, and seasonal factors. E-commerce affiliates often see rates between 2-4%, while lead generation can range from 8-15% depending on the vertical and targeting precision.

Mobile traffic converts 30-40% lower than desktop visitors, though this gap has shrunk since 2021. You still need different optimization strategies and realistic goals when focusing on mobile campaigns.
Key factors influencing conversion performance:
- Landing page load speed (pages under 3 seconds see 23% higher conversion rates)
- Traffic source quality and intent matching
- Offer-audience alignment and messaging consistency
- Seasonal trends and market timing
- Device optimization and user experience design
- Geographic and demographic targeting precision
Essential calculation formulas
Cost Per Action Calculation: Total advertising spend divided by number of completed actions. Include all associated costs for accuracy – platform fees, creative development, testing expenses, and management time.
Earnings Per Click Formula: Total commission revenue divided by total clicks generated. Track this metric daily to identify performance trends and optimization opportunities quickly.
Conversion Rate Determination: Number of conversions divided by total visitors, multiplied by 100 for percentage format. Monitor this across different traffic sources and time periods for pattern recognition.
Break-even Analysis: Your maximum acceptable CPA equals the commission value minus operational costs. Stay below this threshold to maintain profitability regardless of volume fluctuations.
Budget protection techniques
Implement automatic bid caps based on your maximum acceptable CPA. Most advertising platforms allow rule-based budget controls that pause campaigns when costs exceed predetermined thresholds.
Split your traffic between different platforms instead of putting everything into one basket. When iOS 14.5 hit in 2021, affiliates who relied mainly on Facebook lost nearly half their income, while those using multiple sources barely felt the impact.
Set aside 20-30% of your budget specifically for testing new methods. This experimentation fund keeps your campaigns evolving without risking your core profitable activities on unproven strategies.
Performance monitoring systems
Daily metric tracking prevents small issues from becoming major problems. Set up automatic notifications when key metrics move outside normal parameters. Sharp CPA increases of 25% or conversion drops of 30% need immediate investigation. Analyze performance across multiple timeframes to identify patterns – weekly reviews catch urgent issues requiring quick fixes, while monthly analysis reveals seasonal trends and campaign development that daily monitoring overlooks.
ROI calculations require accurate CPA, EPC, and CR data as foundational inputs. Without precise measurement of these core metrics, return on investment becomes guesswork rather than strategic planning. This connection makes mastering these three measurements essential for serious affiliate marketing success.


[…] Cost per action (CPA) tells you exactly what you’re paying to generate a single conversion, whether that’s a lead, sale, or registration. If you spent $300 on traffic and got 15 conversions, your cost per action is $20. Simple math, but critical for understanding your cost structure. […]