Traffic arbitrage goes beyond simply purchasing visits and crossing your fingers for results. Success here demands precision, where each invested dollar must generate returns that exceed the initial outlay. This is exactly why ROI matters so much, it’s the dividing line between campaigns that actually make money and those that just drain your budget.
Understanding return on investment helps you spot which traffic sources actually work, which offers convert, and where you’re bleeding money without realizing it. Without proper tracking, you’re essentially flying blind, making decisions based on gut feeling rather than hard numbers.
Table of contents
- What ROI actually means in affiliate marketing
- Why ROI beats other performance metrics
- Core metrics you need: CPA, EPC, and CR
- How to calculate ROI the right way
- Real strategies to boost your return
- Common mistakes that kill profitability
- Tools that make tracking easier
- Industry benchmarks worth knowing
What ROI actually means in affiliate marketing
Return on investment shows you exactly how much profit you’re generating for every dollar you put into iGaming traffic. It’s not about vanity metrics like impressions or clicks. It’s about cold, hard cash flowing back into your pocket.
Think of it this way: you spend $500 on Facebook ads, drive traffic to a sweepstakes offer, and earn $750 in commissions. Your ROI tells you whether that $250 difference was worth your time and if you should scale up or shut down the campaign immediately.

Most affiliates get stuck chasing volume instead of profitability. They see thousands of clicks and feel successful, but their bank account tells a different story. Return on investment cuts through that noise and forces you to face reality. Between 2020 and 2024, successful media buyers reported focusing 68% more on profit optimization compared to simple conversion tracking.
Why ROI beats other performance metrics
Other metrics matter, sure. Conversion rate tells you if your landing page works. Click-through rate shows if your creative grabs attention. Cost per action reveals what you’re paying for each lead or sale.
But none of these metrics exist in isolation. A 5% conversion rate means nothing if you’re paying $10 per click on an offer that pays $20. You’d be losing money with a seemingly great conversion rate.
ROI is the only metric that accounts for both sides of the equation: what you spend and what you earn. It gives you the complete picture. You can have a low conversion rate but stellar returns if your traffic is cheap enough. Or you can have amazing conversions but terrible profitability if your traffic costs are through the roof.
Here’s what makes this metric particularly valuable:
- It allows you to compare completely different traffic sources on equal footing
- You can instantly see which campaigns deserve more budget
- It helps you make scaling decisions based on actual profitability
- Partners and investors understand the numbers immediately, no explanation needed
- It forces you to think about efficiency, not just activity
Core metrics you need: CPA, EPC, and CR
Before you can properly calculate and optimize returns, you need to understand three foundational metrics that feed into it. These numbers form the building blocks of profitable arbitrage.
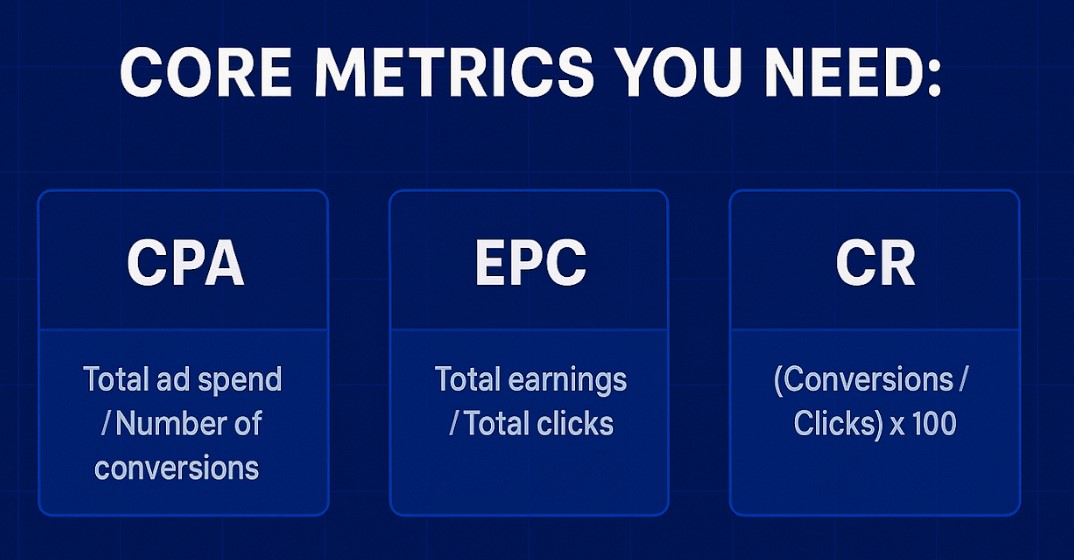
Cost per action (CPA) tells you exactly what you’re paying to generate a single conversion, whether that’s a lead, sale, or registration. If you spent $300 on traffic and got 15 conversions, your cost per action is $20. Simple math, but critical for understanding your cost structure.
Earnings per click (EPC) shows the average revenue generated from each visitor you send to an offer. This metric reveals the true value of your traffic quality. If 100 clicks earned you $40 in commissions, your earnings per click sit at $0.40. High numbers here usually mean your traffic matches the offer well and your targeting is dialed in.
Conversion rate (CR) measures the percentage of visitors who complete the desired action. Out of 500 clicks, if 25 people converted, you’re sitting at a 5% rate. This number reflects how well your funnel, landing page, and offer alignment perform together.
These three metrics work together to paint your profitability picture. You might have a fantastic conversion rate of 8%, but if your CPA is $50 and the offer pays $40, you’re still losing money. On the flip side, a 2% conversion rate could be wildly profitable if your traffic costs are low enough and the payout is strong.
| Metric | Formula | What it reveals |
| CPA | Total ad spend / Number of conversions | Your acquisition cost efficiency |
| EPC | Total earnings / Total clicks | Revenue potential per visitor |
| CR | (Conversions / Clicks) × 100 | Funnel and offer performance |
| ROI | ((Revenue – Cost) / Cost) × 100 | Overall campaign profitability |
How to calculate ROI the right way
Calculating return on investment isn’t complicated, but many affiliates mess it up by forgetting hidden costs or using the wrong formula. The basic formula looks like this: take your total revenue, subtract your total costs, divide by your total costs, then multiply by 100 to get a percentage. If you earned $2,000 from a campaign that cost $1,200 to run, your calculation would be
(($2,000 – $1,200) / $1,200) × 100, giving you a return of 66.67%.
But here’s where most people go wrong. They only count ad spend as their cost. In reality, your total investment includes tracker subscriptions, spy tool fees, VA payments, and even your own time if you’re being honest about it.
Let’s say you ran a push notification campaign promoting a betting offer. You spent $800 on PropellerAds traffic, $50 on your Voluum tracker for the month, and $100 on creatives from a designer. Your real cost is $950, not just $800. If that campaign generated $1,500 in revenue, your actual return is 57.89%, not the inflated 87.5% you’d get by ignoring those extra expenses.
Another mistake is looking at numbers too early. A campaign might show negative returns in the first few days while you’re testing and optimizing. You need to give it enough time and volume to stabilize before making decisions. On the other hand, some campaigns look profitable initially but tank once the offer caps or the traffic source quality drops.
Real strategies to boost your return
Improving profitability isn’t about one magic trick. It’s about systematically finding inefficiencies and eliminating them while doubling down on what works. Here’s how experienced media buyers actually do it.
Cut the dead weight immediately. Every campaign has placements, keywords, or audience segments that drain money without converting. Use your tracker data to identify anything with zero conversions after spending 2-3 times your target CPA. Blacklist it and reallocate that budget to profitable segments. In practice, this alone can lift campaign effectiveness by 30-40% within a week.
Test aggressively, scale carefully. Launch multiple ad variations, landing pages, and angles simultaneously. Small creative changes can shift conversion rates dramatically. But when you find a winner, don’t just throw all your money at it immediately. Scale gradually, maybe 20-30% budget increases every few days, watching for quality drops as you scale.
Optimize for buyer intent, not just clicks. Cheap traffic is worthless if it doesn’t convert. Sometimes paying 2x more per click gets you traffic that converts at 4x the rate, resulting in better overall returns. Focus on traffic quality signals like time on site, pages per visit, and post-click behavior patterns.
Leverage retargeting and sequential messaging. Your first touchpoint rarely converts. Building retargeting audiences and hitting them with different angles or social proof can turn break-even campaigns into profit machines.
Here are additional proven tactics that consistently deliver results:
- Split test landing page load times, as every second of delay can cost you 7-10% in conversions
- Implement geo-specific currency and language variations to increase trust and reduce friction
- Use dynamic keyword insertion in your ads to boost relevance scores and lower acquisition costs
- Set up custom audiences based on engagement depth rather than just clicks
- Test different bidding strategies like target CPA versus manual bidding to find optimal cost efficiency
- Monitor competitor activity patterns and adjust your bidding during their low-activity periods
- Create lookalike audiences from your best converters, not just all converters
- Add negative placements proactively based on industry blacklists before wasting budget
Negotiate better deals. Once you prove an offer converts well with your traffic, approach the network or advertiser directly for higher payouts. Even a 10% bump in commission dramatically impacts your bottom line without changing anything else about your campaign structure.
Common mistakes that kill profitability
Most affiliates know what they should do, but they still make predictable errors that destroy their profitability. Recognizing these patterns helps you avoid them.
Ignoring the data and trusting your gut. You think an ad creative is amazing because it looks good to you. But your target audience isn’t you. If the numbers show it’s not converting, kill it and move on. Emotional attachment to campaigns, creatives, or offers is expensive.
Spreading budget too thin. Running 20 different campaigns with $10 daily budgets each doesn’t give any of them enough volume to optimize properly. You’re better off focusing that $200 on 3-4 campaigns that can actually reach statistical significance and show you what works.
Stopping winners too early. A campaign has a rough day or two, so you panic and pause it. Traffic sources fluctuate. Algorithms shift. What matters is the 7-day or 30-day trend, not yesterday’s performance. Unless something is catastrophically broken, give your data time to stabilize.
Chasing shiny objects constantly. You hear about someone crushing it with TikTok ads, so you abandon your profitable Facebook campaigns to chase the new thing. Diversification matters, but not at the expense of optimizing what’s already working. Expand strategically, don’t just jump to whatever sounds exciting this week.
Tools that make tracking easier
You can’t optimize what you don’t measure accurately. The right tools give you visibility into every part of your funnel and make calculations automatic rather than manual guesswork.
Tracking platforms like Voluum, BeMob, or RedTrack are essential. They collect data on every click, conversion, and cost in real-time. Instead of manually calculating returns in spreadsheets, your tracker does it automatically and shows you exactly which campaigns, sources, and segments are profitable. Most serious affiliates consider a quality tracker the single most important tool investment, typically costing $50-200 monthly depending on traffic volume.
Analytics layers beyond basic tracking give you deeper insights. Integrating Google Analytics or custom event tracking shows you behavioral data that pure conversion tracking misses. You can see bounce rates, session duration, and how users navigate your funnel, revealing optimization opportunities that aren’t obvious from conversion data alone.
Spy tools like Anstrex or AdPeriscope show you what competitors are running and how long their campaigns have been active. If an ad has been running for months, it’s probably profitable. You can reverse-engineer successful approaches instead of reinventing the wheel, dramatically shortening your path to positive returns.
Automation platforms handle the tedious optimization work. Tools like Adefy or custom scripts can automatically pause underperforming placements, adjust bids based on profitability thresholds, and scale winners without constant manual intervention. This keeps your campaigns tight even when you’re not watching them 24/7.
Industry benchmarks worth knowing
Understanding where your performance stands relative to industry standards helps you set realistic expectations and identify areas for improvement. These benchmarks vary significantly by vertical, traffic source, and geographic targeting, but they provide useful reference points.
| Vertical | Average ROI | Typical CPA Range | Expected CR |
| E-commerce | 150-300% | $15-45 | 2-4% |
| Lead generation | 200-400% | $8-25 | 3-6% |
| Dating offers | 100-250% | $3-12 | 1-3% |
| Gaming/Casino | 80-200% | $20-80 | 0.5-2% |
| Finance/Crypto | 120-280% | $30-120 | 1-4% |
Keep in mind that these numbers represent averages across thousands of campaigns. Top performers consistently achieve numbers well above these ranges, while newcomers often struggle to break even initially. Your goal should be reaching profitability first, then systematically working toward industry-leading performance.
Geography plays a massive role in these figures. Tier 1 countries like the US, UK, and Canada typically require higher costs per action but convert at better rates and deliver superior EPC. Tier 2 and 3 geos offer cheaper traffic but demand more volume to generate meaningful profit. Between 2022 and 2024, media buyers targeting emerging markets in Southeast Asia reported profitability improvements of 42% on average as those regions matured digitally.
Device type matters more than most realize. Mobile traffic generally costs less but converts differently than desktop. In some verticals like app installs or mobile gaming, mobile delivers 3-5x better returns than desktop. For financial offers or B2B lead generation, desktop often outperforms despite higher costs.